Turbulence & Wind Shear Detection
Real time, reliable turbulence and wind shear detection. Patented.
Wake Watch’s Turbulence and Wind Shear Detection System helps airport improve safety and minimize the possibility of a costly go around.
Shown below are three graphics which show the turbulence and wind shear statistics, updated in real time, images updated every 10 minutes.
These graphics only update if the wind speed is > 10 knots, so that only severe turbulence is shown. The availability will now drop to shown the time that the wind speed is > 10 knots.
Refresh/Ctrl F5 to see the latest info of the three images below.
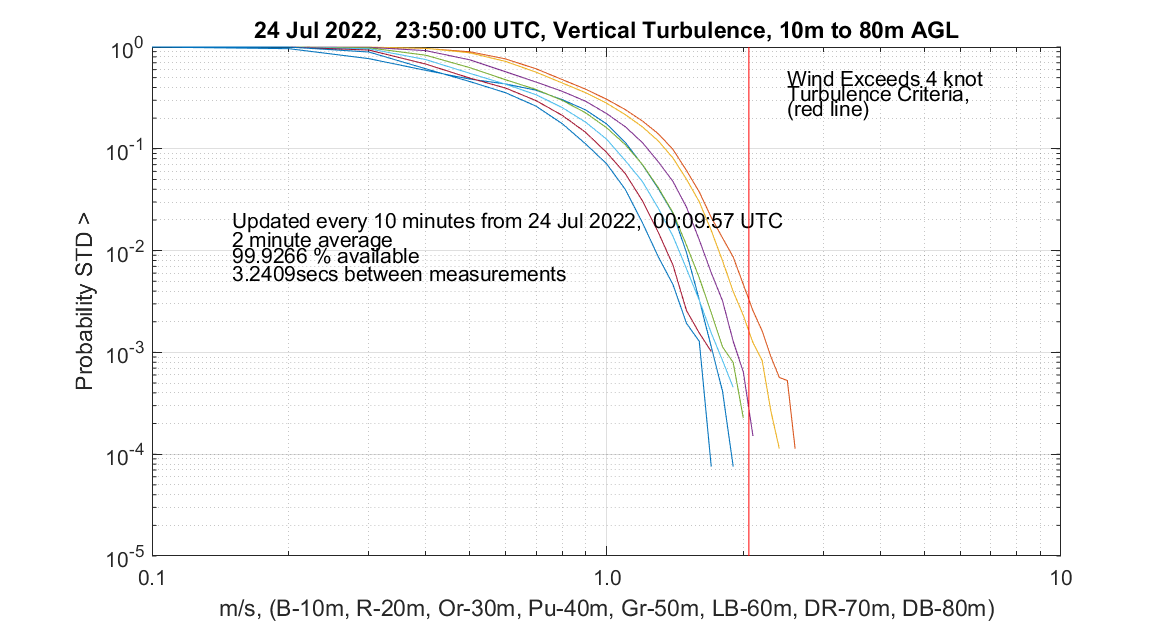
Shown above is the vertical turbulence by measuring probability of the Standard Deviation of the vertical wind speed at heights between 10m and 80m, measured every 3.2 seconds over a 10 minute period with 2 minute averaging. This shows the vertical turbulence. The 4knot criteria for the Standard Deviation limit is also shown by the red vertical line.
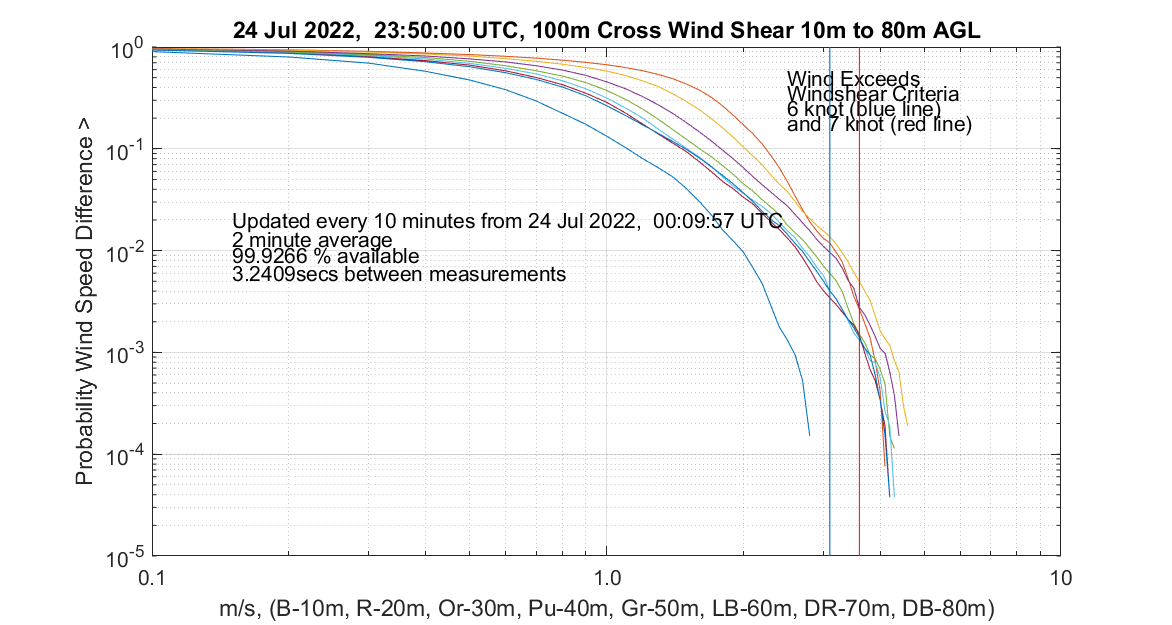
Shown above is the horizontal wind shear by measuring the probability of the wind speed difference over a 100m distance at heights between 10m and 80m, measured every 3.2 seconds over a 10 minute period with 2 minute averaging. The 6knot and 7knot criteria for the Wind Speed Difference limit is also shown. For the results above it is often the case that the horizontal wind shear limits are exceeded, this difference in wind speeds close to the ground is due to a nearby Box Tree forest. The difference in wind speeds that exceed the horizontal wind shear limits close to the ground also occur when a South to West wind is present due to a Box Tree forest to the West of the measurement point.
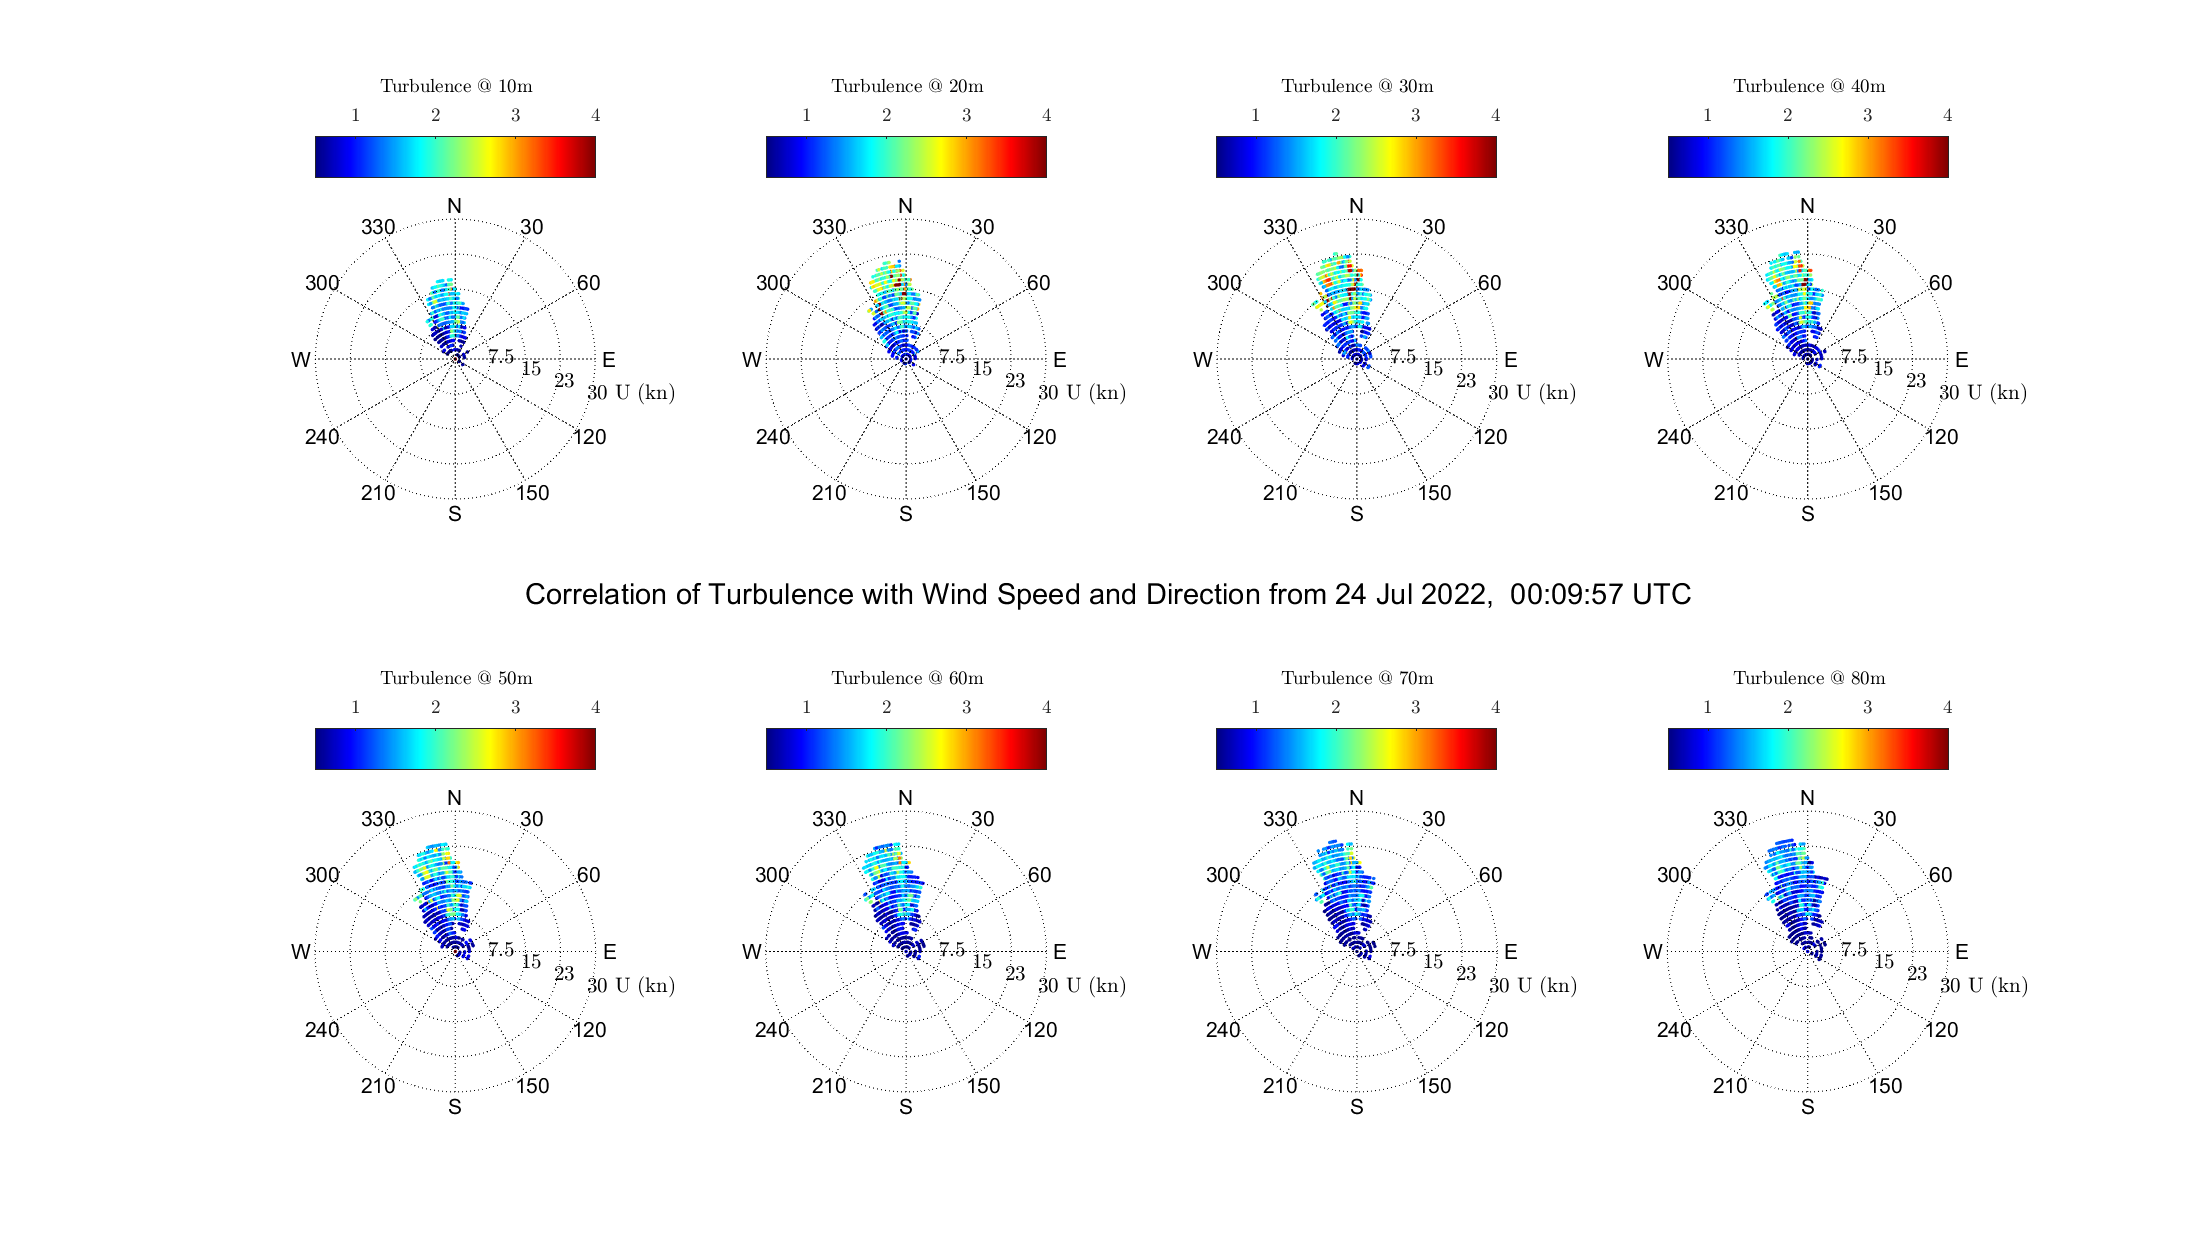
Shown above are wind roses for each height from 10m to 80m (green). Also shown is the wind direction and speed where the vertical turbulence intensity exceeds 4 knots (red) for each height, measured every 3.2 seconds with 2 minute averaging. This data is similar to that of the vertical turbulence measurement shown above except that the wind direction and speed are also shown. A similar plot can also be made for the cross-wind shear over a distance of 100m.
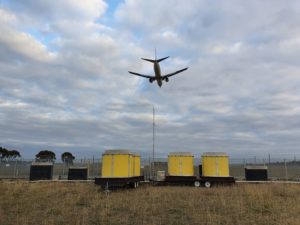 System for measuring the Standard deviation of the wind directly under the 16 approach at Melbourne Airport.Wake Watch’s Wind Shear Detection and Warning Solution makes real time measurements of dangerous wind shear conditions on approach. The system can measure horizontal wind shear over distances between 100m every 3 seconds (greater distances are also possible). Vertical wind shear is also measured over 8 heights between 10m to 80m every 3 seconds. The very high update rate of this system enables timely measurements of any shear that can adversely affect aircraft landing performance including wind shear due to aircraft wake vortices.
This system is also well suited to making measurements of the mechanical wind shear caused by buildings and terrain around airports. The standards for wind shear used above are from Guideline B
The Bureau of Meteorology also give guidance about the weather conditions that cause wind shear in http://www.bom.gov.au/aviation/data/education/wind-shear.pdf