Wind Profiles
Wind Watch
Real time, reliable wind profiler. Patented.
Wind Watch is a new-generation wind profiler, able to provide detailed and accurate information about winds to 400 meters. The data below is from our wind profiler 100m to the west of the 16 approach at Melbourne airport.
Note that the meteorological conditions shown here are specific to Melbourne Airport. To develop a now-casting system for any given airport, long term measurements will be required at that airport as an understanding of the local meteorological conditions is critical for optimizing safety and capacity and delivering a reliable weather dependent spacing system. See a brief report about this subject on our reports page.
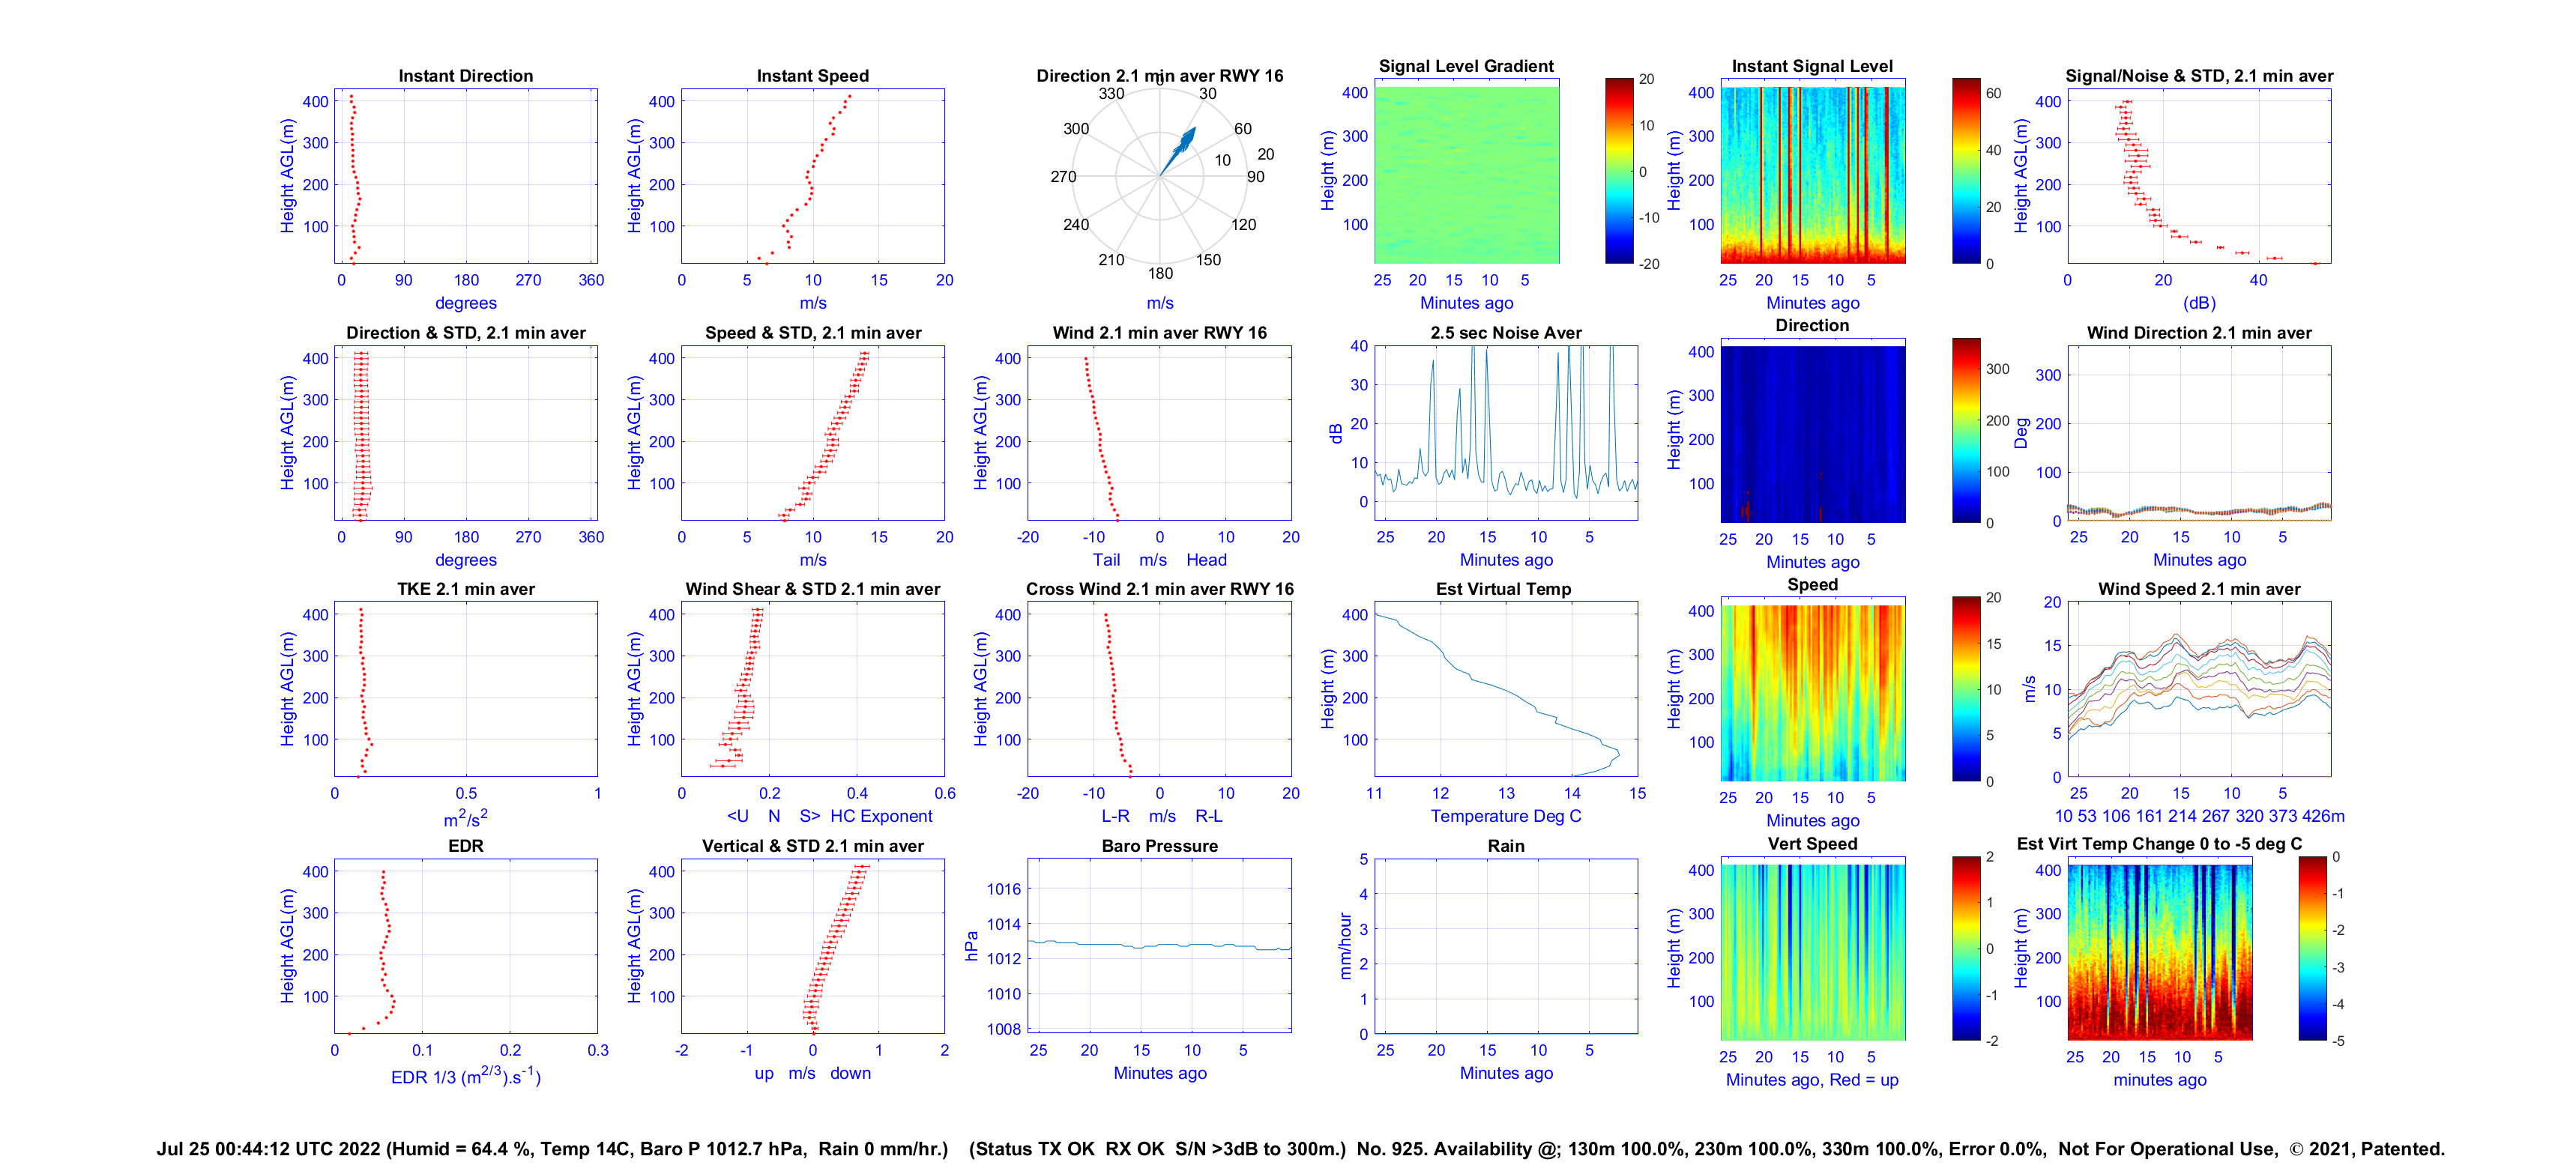
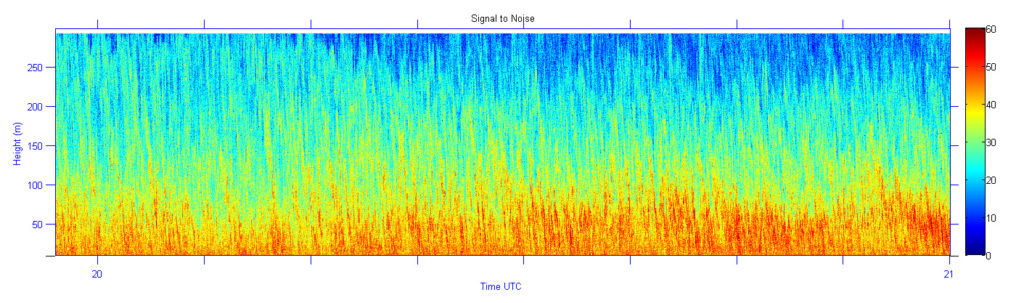
The wind profiler results being shown below are able to provide information about the structure of the atmosphere, in particular, the presence and heights of inversion layers. The results from the Melbourne airport met and wake systems indicate that long lived wake vortices occur when inversion layers are present. The signal level gradient shown below in the top row, 4 across, readily indicates the presence of such inversion layers.
Shown below is the wind in real time. Refresh/Ctrl F5 to see the latest info below.
This wind profiler is not dependent on visibility and can ‘see through’ fog and inversion layers to report on wind conditions and hazards above them. A detailed explanation of the wind profiles is given in “About The WakeWatch Wind Profiler – With Examples.pdf”, which is available for download in the Reports section. An explanation of how the chirp SODAR works, “About Chirp SODAR.pdf”, is also available for download in the Reports section. There is also a videos on the reports page that provides a day of wind profiles, wake measurements for the same time are also available on the reports page.
Importantly, Wind Watch meets European ATM master Plan requirements for wind profilers, see METEO-03, METEO-03c, METEO-04b, METEO-04c, and METEO-04d. Further, through the use of multiple airfield wind profilers and appropriate micro-scale met models the requirements for METEO-08b could also be met.
Other examples of the wind profiler operation are shown below.
MATLAB Handle Graphics
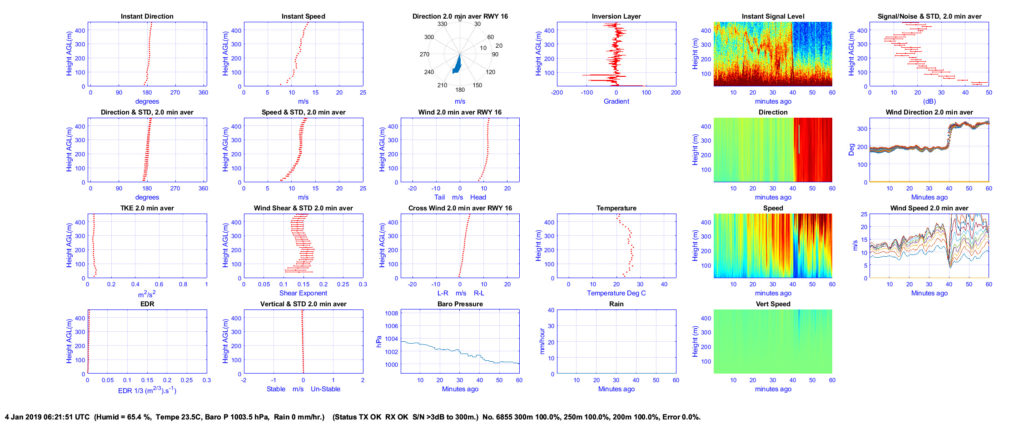
A gust front change is very evident whereby the wind direction and speed change, also showing a change in the atmospheric structure.
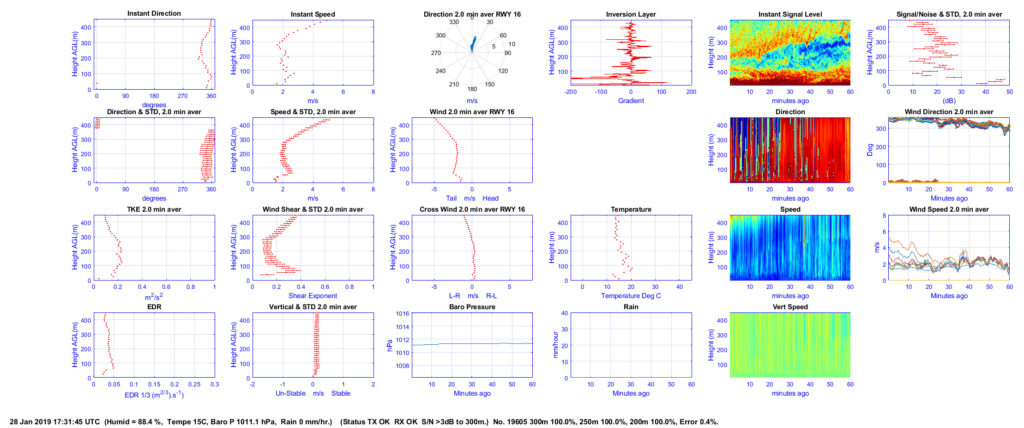
Strong Temperature Inversion
A strong temperature inversion layer is shown at Melbourne Airport between 16:30 and 17:30 UTC on January 28 2019. This inversion layer is strong enough to cause wake vortices to be very long lived and is a hazard to any aircraft following too closely behind. There is also some vertical wind shear through the inversion layer.
MATLAB Handle Graphics
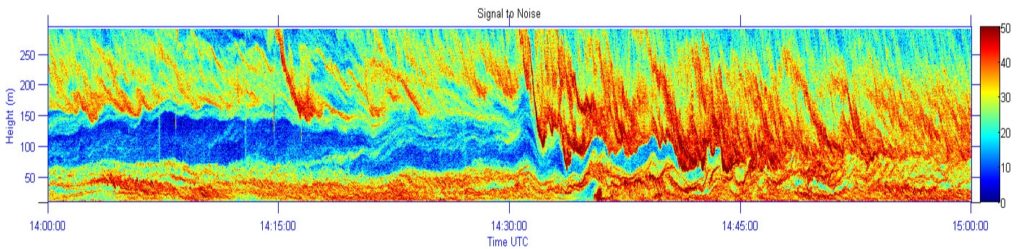
Temperature inversion layers on 6 May 2014 at Melbourne Airport. Aircraft wake vortices can be very long lived.
Neutral Atmospherefresh